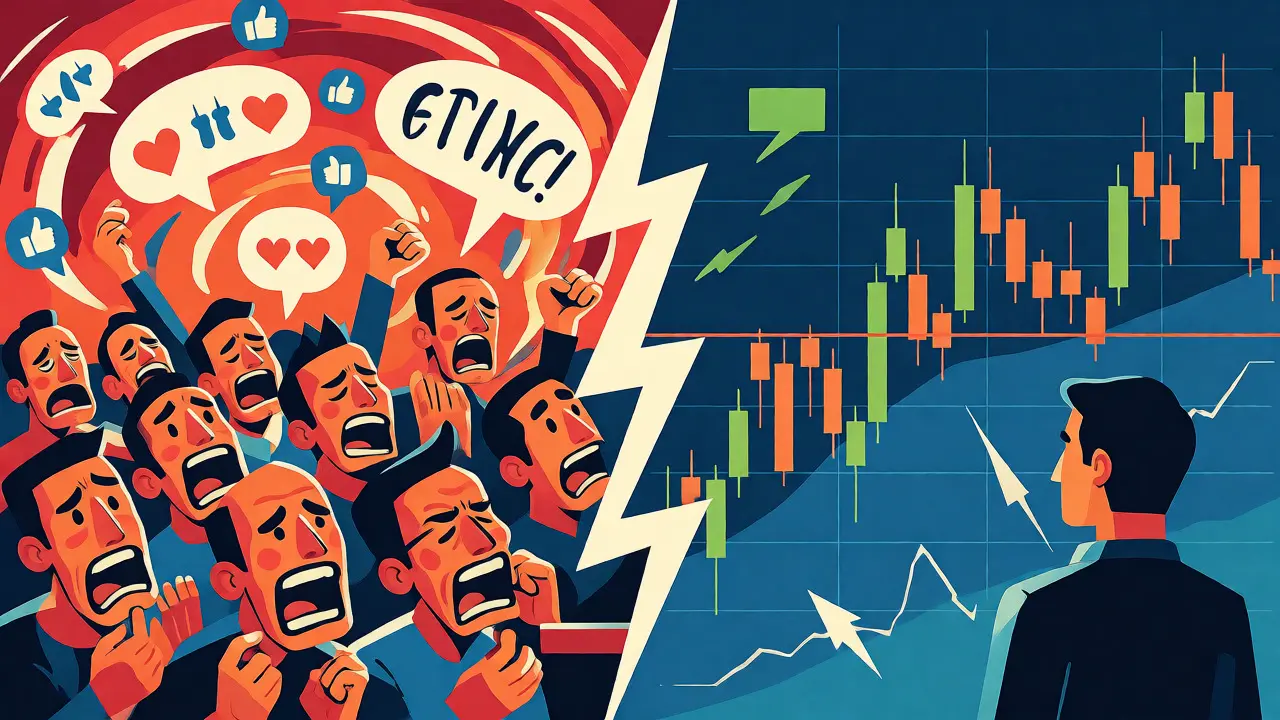

Imagine staring at a Bitcoin chart. The price is skyrocketing, but the volume is thinning out. Do you buy because everyone else is buying (sentiment), or do you sell because the candlestick pattern screams exhaustion (price action)? This isn't just a philosophical debate; it’s the difference between making money and blowing up your account. In the volatile world of blockchain assets, understanding whether to trust the crowd's emotion or the cold hard data of price movement is critical.
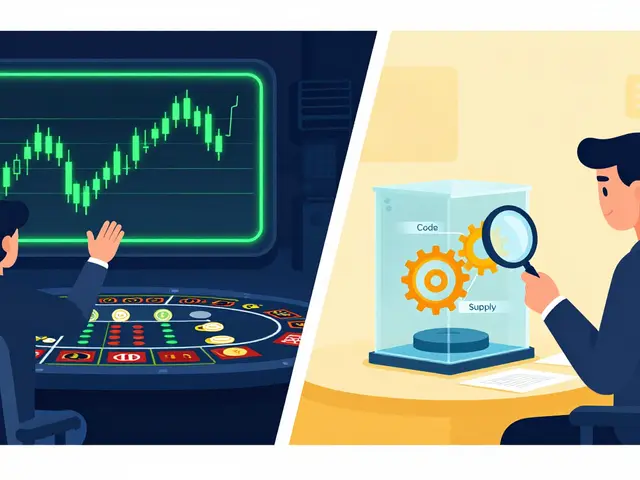
Market sentiment is essentially the collective mood of every trader in the market. It’s fear, greed, hope, and panic rolled into one quantifiable metric. On the other side, price action is the raw history of what has actually happened-candlesticks, trends, and support levels without any lagging indicators. While many traders treat these as enemies, the smartest ones know they are two sides of the same coin. Let’s break down how each works, where they fail, and how to combine them for better trades in 2026.
What Actually Moves Markets: Emotion or Data?
To understand the battle, you have to look at the tools. Market sentiment analysis relies on measuring human psychology through specific instruments. The most famous is the CBOE Volatility Index (VIX), often called the "fear gauge." When the VIX spikes above 30, it signals extreme fear. Below 15? That’s complacency. But in crypto, we also watch social media buzz, funding rates on perpetual futures, and exchange inflows.
Price action, however, doesn’t care about feelings. It cares about supply and demand. Traders using this method look for patterns like pin bars, inside bars, or head-and-shoulders formations. These patterns represent real transactions that occurred. If buyers overwhelmed sellers at $60,000, that resistance level is real. If sentiment says "everyone is bullish," but price fails to break that level, price action tells you the bulls are lying.
| Feature | Market Sentiment Analysis | Price Action Trading |
|---|---|---|
| Primary Focus | Trader psychology & positioning | Historical price movements & patterns |
| Key Indicators | VIX, Put/Call Ratio, COT Reports | Candlesticks, Support/Resistance, Trends |
| Best For | Identifying market extremes & reversals | Precise entries/exits in trending markets |
| Speed of Signal | Lagging (reflects past emotion) | Leading (reacts to current order flow) |
| Subjectivity | Low (quantitative data) | High (pattern interpretation varies) |
The Power of Reading the Crowd (Sentiment)
Sentiment analysis shines when markets are irrational. Think back to the GameStop squeeze in 2021. Fundamentals said the stock was cheap, price action showed volatility, but sentiment indicated a massive short squeeze. Retail traders flooded in, ignoring traditional value metrics. In crypto, this happens constantly with meme coins. If the Put/Call Ratio drops below 0.5, it means traders are betting heavily on upside. This can be a warning sign-if everyone is already long, who is left to buy?
Institutional investors lean heavily on sentiment. According to recent surveys, nearly 80% of hedge funds use sentiment data daily. They track things like the Commitment of Traders (COT) report, which shows how commercial hedgers are positioned. If big players are selling while retail is buying, that divergence is a powerful signal. However, sentiment has a major flaw: it’s easily manipulated. Bots can flood Twitter with bullish emojis, skewing social sentiment scores without actual capital flowing into the asset.
The Truth in the Charts (Price Action)
Price action purists argue that sentiment is just noise. Why guess what people feel when you can see what they did? A simple rule in price action is "the trend is your friend." If Bitcoin is making higher highs and higher lows, you buy dips. You don’t need to know if Elon Musk tweeted something funny. You just need to see that buyers stepped in at previous support levels.
This method requires discipline. You need to learn to read candlestick patterns. A Pin Bar (a candle with a long wick rejecting a price level) suggests rejection. If this forms at a key support zone, it’s a high-probability buy signal. Studies show pin bars have a success rate over 70% in trending markets. But here’s the catch: price action is subjective. Two traders can look at the same chart and see different patterns. One sees a breakout; the other sees a fakeout.
Another advantage is speed. Sentiment indicators often lag. By the time the Fear & Greed Index hits "Extreme Fear," the bottom might already be in. Price action reacts instantly to news events. If the SEC announces a new regulation, the price moves before sentiment trackers update their algorithms.
Where Each Method Fails
No tool is perfect. Sentiment analysis struggles during low-liquidity periods. In crypto, weekends often have thin volume. Sentiment indicators can give false signals because small orders move the needle disproportionately. A single whale dumping tokens can spike volatility indices, tricking sentiment tools into seeing panic where there is none.
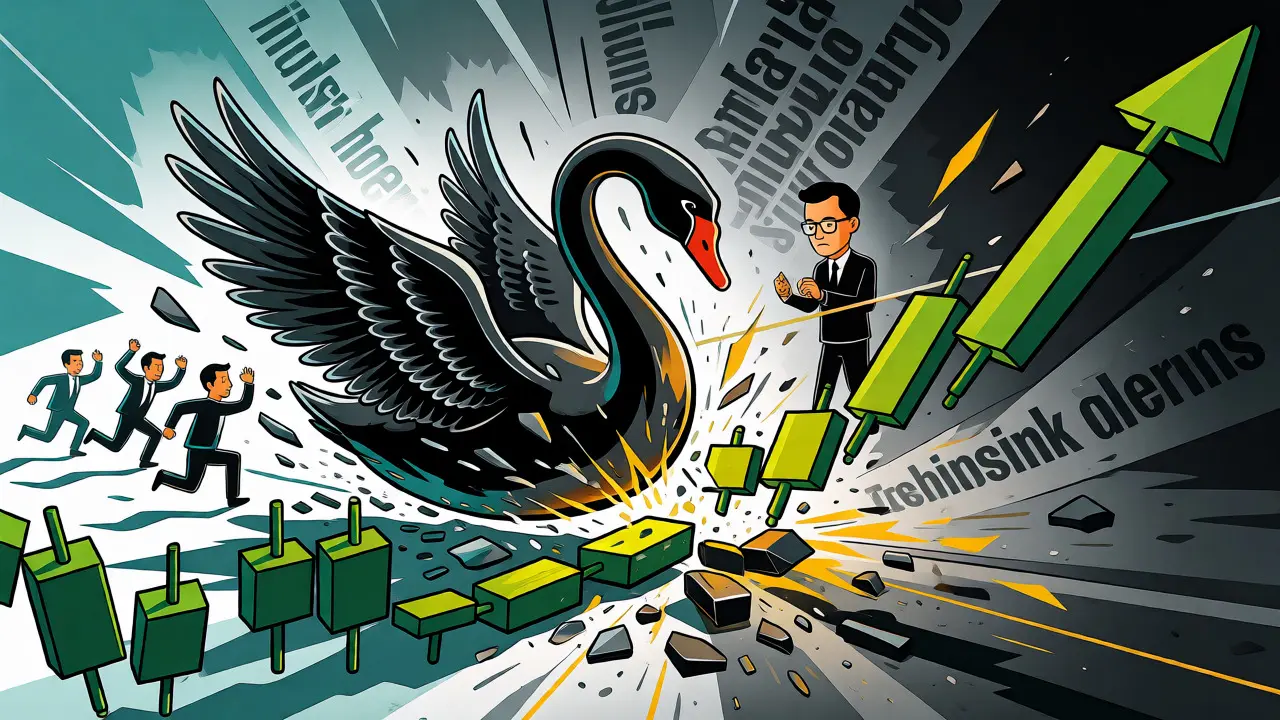
Price action fails spectacularly during black swan events. During major news announcements, like interest rate hikes or exchange hacks, technical patterns break down. A clean uptrend can collapse in minutes due to external factors. Relying solely on charts during these times is like driving blindfolded. Furthermore, price action requires significant screen time. Mastering pattern recognition takes months, if not years, of practice.
The Winning Strategy: Combining Both
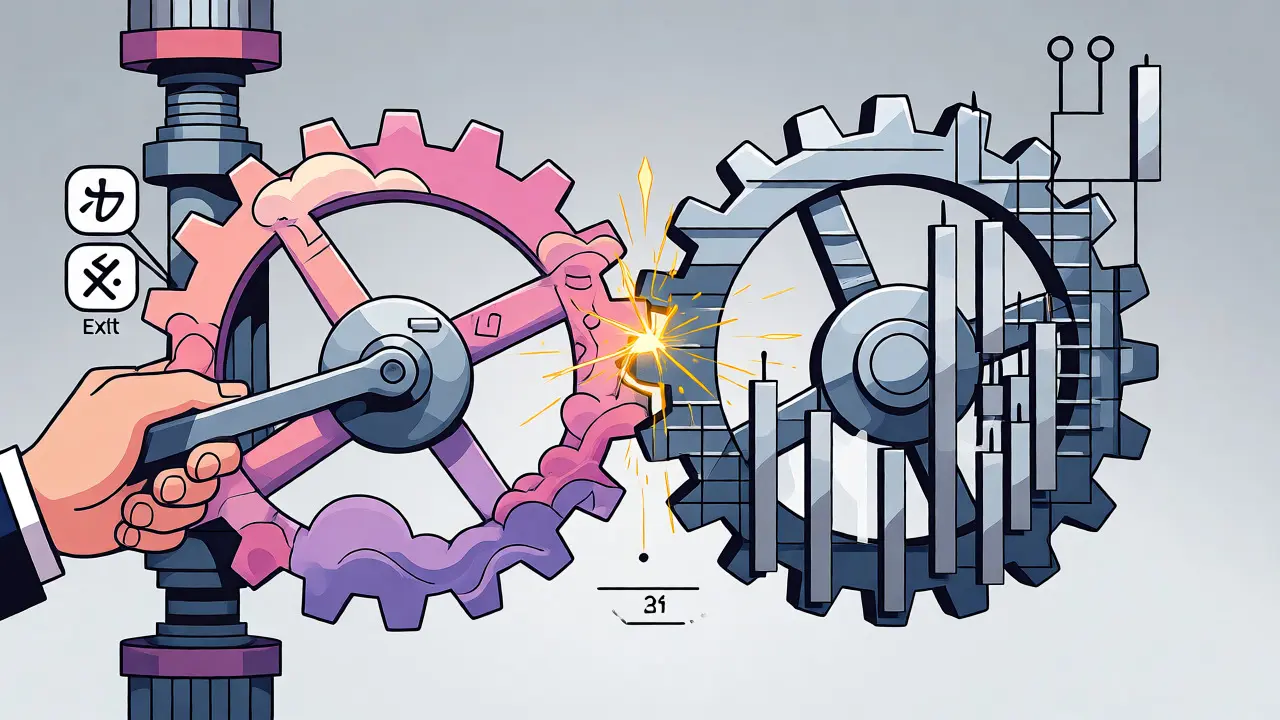
So, should you pick a side? Most profitable traders don’t. They use sentiment for context and price action for execution. Here is a practical workflow:
- Step 1: Check Sentiment Extremes. Look at the VIX or crypto-specific fear/greed indices. Is the market overly optimistic or pessimistic? Extreme readings often precede reversals.
- Step 2: Identify Key Levels. Use price action to find strong support or resistance zones on higher timeframes (daily or weekly).
- Step 3: Wait for Confirmation. Don’t buy just because sentiment is fearful. Wait for a price action signal, like a bullish engulfing candle, at that support level.
- Step 4: Execute. Enter the trade with a tight stop-loss based on the price structure, not the sentiment reading.
This hybrid approach filters out bad trades. If sentiment is neutral, you might skip a price action setup because the market lacks momentum. If price action breaks a key level but sentiment remains stuck in the middle, it might be a trap. Combining them reduces failure rates significantly. One study found that combining sentiment extremes with price action reversals generated nearly double the annual returns compared to using either method alone.
Practical Tips for Crypto Traders
If you’re new to this, start small. Don’t try to master both simultaneously. Pick one indicator, like the Funding Rate for sentiment or Pin Bars for price action, and stick with it for three months. Keep a trading journal. Note down why you entered a trade. Was it because the chart looked good? Or because everyone on Reddit was talking about it?
Be wary of social media hype. Twitter sentiment is noisy. Always verify with harder data, such as open interest changes or exchange net flows. And remember, no indicator predicts the future. They only manage risk. If your stop-loss gets hit, accept it. Don’t argue with the market because your sentiment analysis said it "should" go up.
Is market sentiment more accurate than price action for crypto?
Neither is inherently more accurate; they serve different purposes. Sentiment helps identify potential turning points at emotional extremes, while price action provides precise entry and exit points. Using them together yields better results than relying on one exclusively.
How do I measure market sentiment in cryptocurrency?
Common metrics include the Crypto Fear & Greed Index, Bitcoin dominance ratios, perpetual futures funding rates, and social media volume analysis. High positive funding rates often indicate overcrowded long positions, signaling potential downside.
Can price action work without indicators?
Yes, pure price action trading relies solely on candlestick patterns, support/resistance levels, and trendlines. Many professional traders prefer this 'clean chart' approach to avoid the lag associated with moving averages or oscillators.
Why does sentiment sometimes contradict price movement?
Sentiment reflects expectations, while price reflects reality. If the market expects good news (high sentiment) but the news is merely 'as expected,' price may drop as traders take profits. This divergence is common in efficient markets.
How long does it take to master price action?
It typically takes 9-12 months of consistent practice to become proficient. This involves studying thousands of historical charts to recognize recurring patterns and developing the intuition to distinguish valid setups from false breaks.


Categories
Popular Articles