
Imagine buying a stock in a company that hasn't decided how many shares it will ever issue. That is the reality for many investors in early-stage blockchain projects. Understanding token supply and distribution is not just about reading numbers on a chart; it is about predicting whether a project will dilute your holdings or hold steady as the network grows. If you have ever wondered why a coin's price drops despite good news, the answer often lies in the hidden mechanics of how new tokens enter the market.
This guide breaks down the core components of tokenomics without the jargon. We will look at the difference between what is actually trading and what is locked away, how major networks like Bitcoin and Ethereum handle issuance, and why the allocation pie matters more than the total number of coins. By the end, you will know exactly where to look before committing capital to a new asset.
The Three Numbers You Need to Know
When analyzing any cryptocurrency, three specific metrics define its economic state. Confusing these leads to mispriced assets and poor investment decisions. Let’s clarify each one with concrete examples.
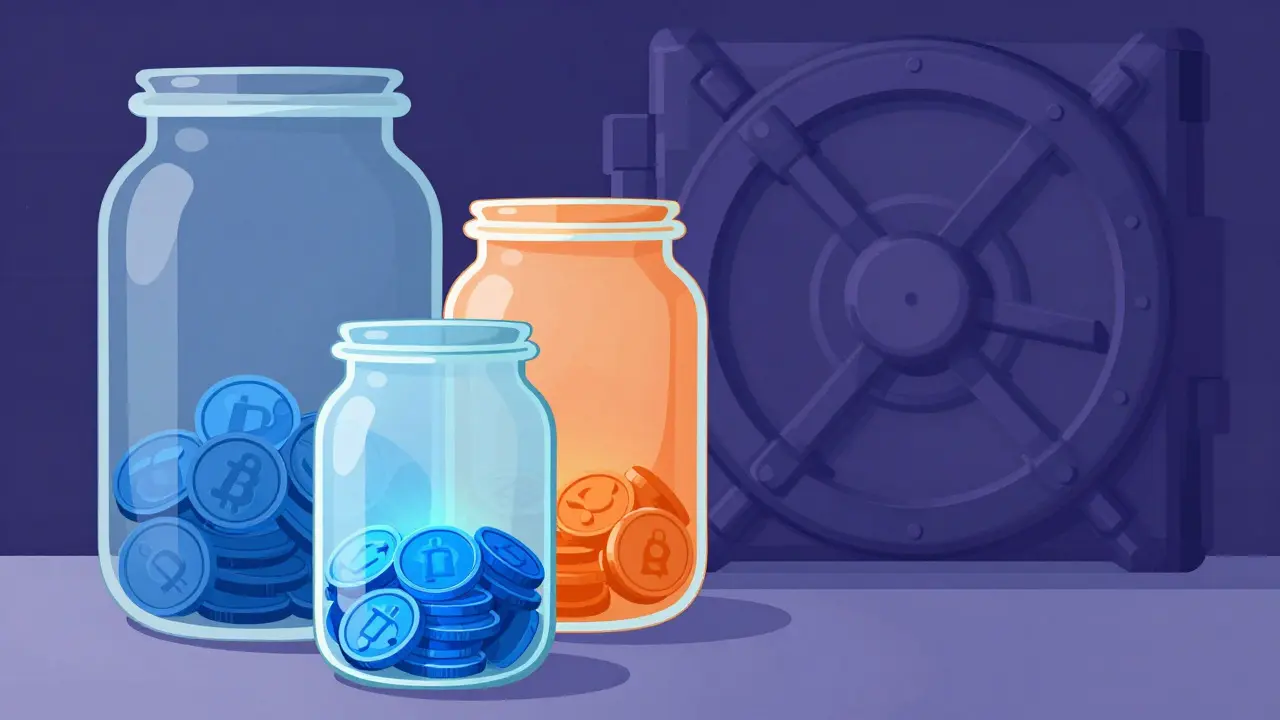
- Circulating Supply: This is the number of tokens currently available for public trade. It excludes tokens held by the team, investors, or in treasury. For example, if a project has 1 billion tokens created but only 400 million are tradable, the circulating supply is 400 million. Market cap calculations rely exclusively on this figure.
- Total Supply: This represents all tokens that have been created so far, including those locked in smart contracts or held by insiders. It is a snapshot of existence, not availability.
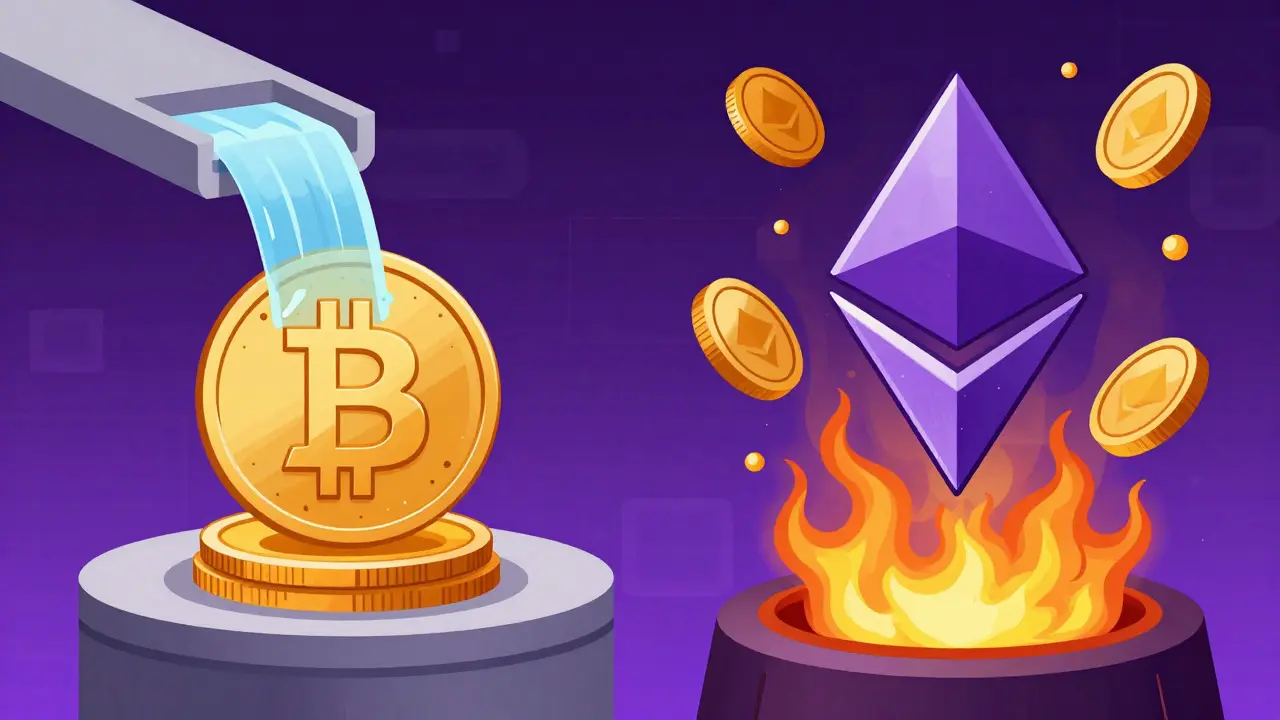
- Maximum Supply: The absolute cap on how many tokens can ever exist. Bitcoin has a hard cap of 21 million. Ethereum, conversely, has no fixed maximum, relying instead on dynamic issuance and burning mechanisms.
The gap between circulating and total supply is critical. If a project has less than 50% of its total supply in circulation, it faces significant dilution risk. Investors often overlook this, focusing only on the current price per token rather than the impending flood of new supply from unlocking schedules.
How Major Networks Manage Issuance
Different blockchains use distinct methods to introduce new tokens into the ecosystem. These mechanisms directly influence inflation rates and long-term value preservation.
| Network | Issuance Model | Key Mechanism | Inflation Trend |
|---|---|---|---|
| Bitcoin | Fixed Supply | Proof-of-Work mining with halving events every ~4 years | Decreasing (Deflationary pressure) |
| Ethereum | Dynamic Supply | Proof-of-Stake validator rewards + EIP-1559 burn mechanism | Variable (Can be net deflationary) |
| Avalanche | Hybrid/Deflationary | Transaction fee burning reduces circulating supply | Decreasing over time |
Bitcoin remains the gold standard for scarcity. Its block reward halved from 50 BTC in 2009 to 6.25 BTC after the May 2020 event, with the next reduction scheduled for April 2024. This predictable schedule creates a known ceiling for future inflation. In contrast, Ethereum shifted to Proof-of-Stake after the Merge. While it issues new ETH to validators, the EIP-1559 upgrade introduced a base fee burn. During periods of high activity, more ETH is burned than issued, resulting in net deflation. Between August 2021 and September 2023, approximately 2.1 million ETH were burned, demonstrating that uncapped supply does not necessarily mean endless inflation.
Why Distribution Allocation Matters More Than Total Supply
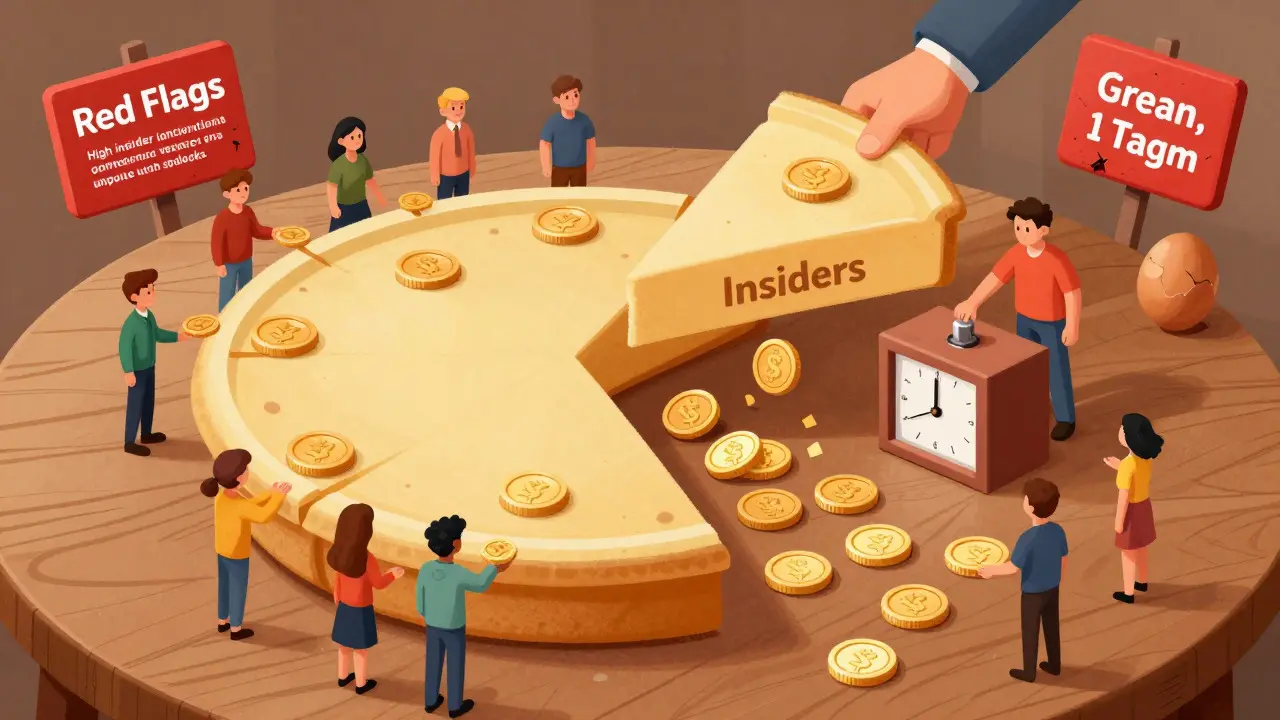
A token with a low total supply is not automatically a good investment if most of it is held by a few people. Token distribution refers to how the initial supply is split among founders, investors, teams, and the community. Poor allocation creates immediate sell pressure when lockup periods end.
Research from the Blockchain Research Institute indicates that successful projects typically maintain a circulating-to-total supply ratio between 50% and 70% during their first 18 months. This balance ensures enough liquidity for trading while reserving tokens for future development and incentives. However, Dr. Neha Narula from MIT’s Digital Currency Initiative warns that projects allocating more than 30% of total supply to insiders often suffer from volatility spikes when those tokens unlock. The median founder allocation across successful projects sits around 22.3%, according to CryptoCompare’s Q3 2023 report. If you see a whitepaper proposing 40% for the team, ask yourself: who pays the bill when they sell?
Vesting schedules act as the safety valve here. Graded vesting over 12 to 24 months for team members prevents a single-day dump that could crash the price. Projects implementing these structured releases saw 43% lower price volatility in their first year compared to those with immediate full unlocks. Immediate liquidity for public sales is generally capped at 15-25% of total supply to ensure fair access without overwhelming the order book.
Red Flags in Tokenomics Design
Not all token distributions are created equal. Certain patterns consistently correlate with higher failure rates, especially during bear markets. Here is what to watch out for:
- High Insider Concentration: If more than 35% of tokens are allocated to insiders with short vesting periods (less than 18 months), the risk of massive sell-offs increases. CoinDesk analysis showed such projects suffered 83% higher failure rates during the 2022 bear market.
- Opaque Unlock Schedules: Transparency is key. Projects that do not clearly disclose when and how tokens will be released create uncertainty. Institutional investors now demand comprehensive issuance schedules before investing, with 78% requiring detailed vesting info according to Fidelity surveys.
- Discretionary Supply Changes: Avoid projects where the team can arbitrarily increase the maximum supply. Fixed caps or algorithmic adjustments (like Ethereum’s burn) provide predictability. Discretionary models lack the trust required for long-term holding.
- Wash Trading Indicators: Projects allocating more than 50% to public sales sometimes experience higher wash trading rates initially. This artificial volume can mask low organic interest, making the token appear more active than it is.
Always cross-reference the stated distribution with the actual on-chain data. Tools like CoinMarketCap now require projects to disclose detailed unlock schedules for listing eligibility, which helps filter out the most opaque designs.
Practical Steps for Evaluating a New Token
Before buying, run through this checklist to assess the health of the token’s supply dynamics:
- Check the Circulating Ratio: Calculate (Circulating Supply / Total Supply) * 100. Aim for projects above 50%. Below 30% signals heavy future dilution.
- Review Vesting Cliffs: Look for large cliffs (e.g., 50% of team tokens unlocking at once). Gradual linear vesting is safer.
- Identify Burn Mechanisms: Does the protocol reduce supply over time? Deflationary features can offset inflation from staking rewards.
- Analyze Use Cases: Is the token needed for fees, governance, or staking? High utility drives demand, which must match or exceed issuance rates to support price.
- Verify Team Allocations: Ensure insider holdings are below 30% and subject to multi-year vesting.
These steps help separate sustainable projects from those built on hype. The goal is to find a balance where supply growth aligns with real-world usage and adoption.
Frequently Asked Questions
What is the difference between total supply and maximum supply?
Total supply is the number of tokens created so far, including locked ones. Maximum supply is the hard cap on how many tokens can ever exist. For Bitcoin, both are approaching 21 million, but for Ethereum, there is no maximum, only a growing total supply modified by burns.
Why does token unlocking cause price drops?
When tokens unlock, holders can sell them for the first time. If a large percentage of the supply unlocks at once, increased sell pressure often outweighs buy demand, leading to price declines. This is why vesting schedules are crucial for stability.
Is a deflationary token always better than an inflationary one?
Not necessarily. Deflationary tokens like Bitcoin offer scarcity, but some ecosystems need inflation to reward validators or incentivize network participation. The key is whether the issuance rate matches the growth in demand. Net deflation during high usage, as seen in Ethereum, is a positive sign of healthy economics.
How do I check the circulating supply of a token?
You can find this data on major aggregators like CoinMarketCap or CoinGecko. Always verify the source, as definitions can vary slightly. Look for the 'Circulating Supply' field specifically, not just the total amount minted.
What role do staking rewards play in token supply?
Staking rewards create new tokens, increasing the total supply. This is a form of inflation. However, if these rewards are used for governance or security rather than immediate selling, the impact on market price may be muted. It is essential to consider the annual inflation rate from staking when evaluating long-term value.