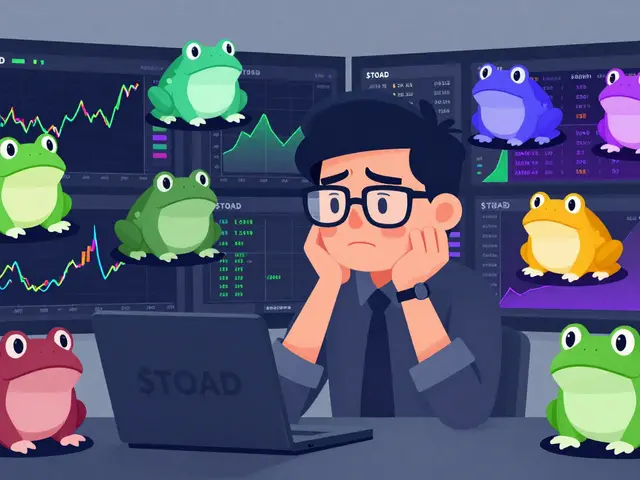

Imagine you are staring at a Bitcoin chart at 3 AM. The price just spiked 5% in ten minutes. Do you buy because the network activity data looks strong? Or do you buy because the RSI indicator just crossed over from oversold territory? This is the eternal debate in the crypto markets: technical analysis versus fundamental analysis. Both methods claim to predict where prices go next, but they look at completely different things. One stares at charts and patterns; the other digs into code, adoption metrics, and economic models.
You might think you need to pick a side. But here is the truth: most successful traders use both. They just weigh them differently depending on their timeframe. If you are day trading altcoins, you care about momentum. If you are holding Ethereum for five years, you care about developer activity. Understanding the difference isn't just academic-it saves you money when the market turns against you.
The Core Difference: Price Action vs. Intrinsic Value
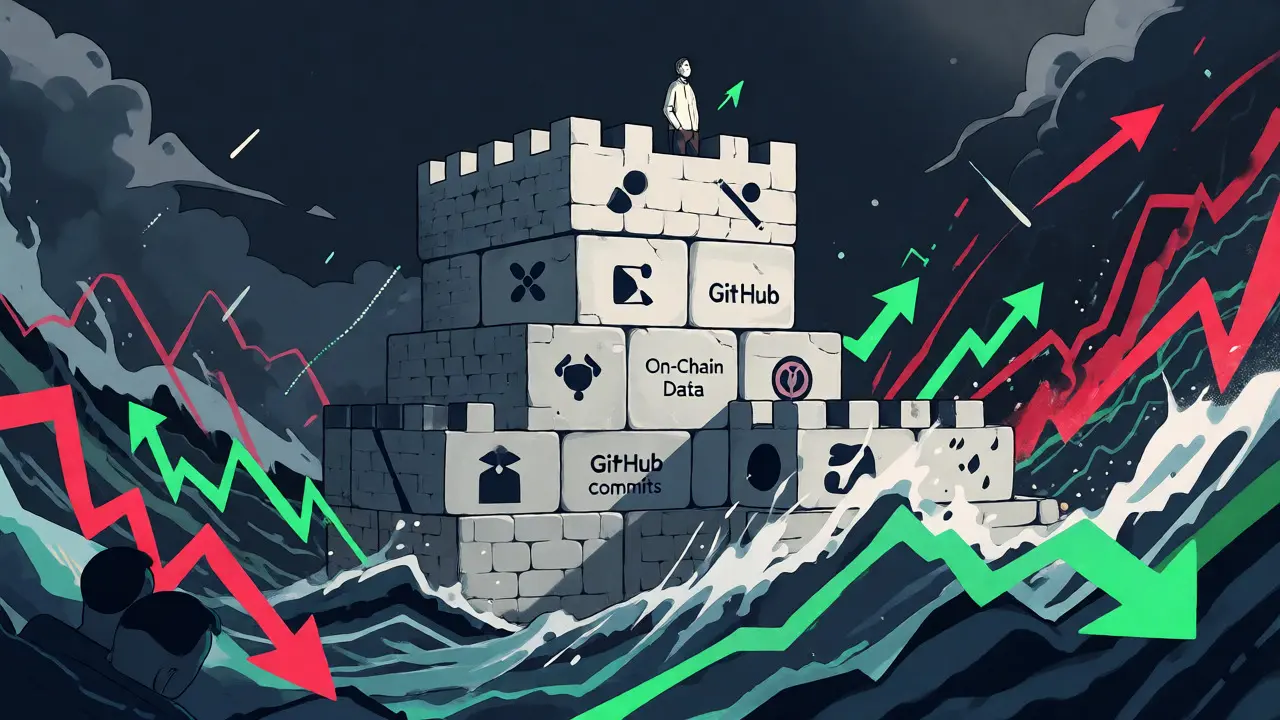
Let's strip away the jargon. Fundamental analysis is about finding the true worth of an asset. It asks, "Is this project actually useful?" You look at revenue, user growth, tokenomics, and real-world utility. In traditional stocks, this means checking earnings reports. In crypto, it means analyzing on-chain data, GitHub commits, and network security.
Technical analysis, on the other hand, ignores what the asset does. It only cares about how people trade it. It assumes that all known information is already priced in. So, why bother reading whitepapers if the chart says "sell"? Technical analysts believe history repeats itself because human psychology doesn't change. Fear and greed drive markets, and those emotions leave footprints on price charts.
| Feature | Fundamental Analysis | Technical Analysis |
|---|---|---|
| Primary Focus | Intrinsic value, financial health, utility | Price action, volume, market sentiment |
| Time Horizon | Long-term (months to years) | Short-term (minutes to weeks) |
| Key Data Sources | Whitepapers, GitHub, TVL, Active Addresses | Candlestick charts, Moving Averages, RSI |
| Best For | HODLers, long-term investors | Day traders, swing traders |
When Fundamental Analysis Saves Your Portfolio
Fundamental analysis is your safety net. It helps you avoid buying garbage tokens that pump on hype but have no underlying substance. Think about the Terra Luna collapse in 2022. Technical charts showed massive uptrends. Everyone was buying. But fundamental analysts saw red flags early: unsustainable yields, centralized control, and a broken algorithmic stablecoin model. If you had looked at the fundamentals, you would have stayed out-or sold before the crash.
In crypto, fundamental analysis relies heavily on on-chain metrics. You aren't looking at quarterly earnings calls like in the stock market. Instead, you check:
- Network Activity: Are active addresses growing? If users leave, the price eventually follows.
- Total Value Locked (TVL): How much capital is stuck in DeFi protocols? High TVL often signals trust.
- Developer Activity: Check GitHub repositories. If developers stop pushing code, the project is dying.
- Tokenomics: Is there too much supply inflation? Will large unlocks dump the price?
This approach takes time. You can't skim it in five minutes. But it builds conviction. When the market drops 30%, a fundamental investor holds because they know the tech still works. A technical trader might panic sell because the support line broke.
Why Technical Analysis Rules Short-Term Trading
If you want to make quick profits, fundamentals are too slow. By the time you read a report on Solana's new upgrade, the price has already moved. That's where technical analysis shines. It gives you entry and exit points based on pure price behavior.
Consider the concept of support and resistance. These are psychological price levels where buyers or sellers historically step in. If Bitcoin bounces off $60,000 three times, traders watch that level closely. The fourth time it hits, many will place buy orders automatically. You don't need to know if Bitcoin is good money to profit from this pattern. You just need to recognize the trend.
Common tools include:
- Moving Averages: Smooth out noise to show the trend direction. The 50-day and 200-day averages are key indicators for many algorithms.
- Relative Strength Index (RSI): Tells you if an asset is overbought (price likely to drop) or oversold (price likely to rise).
- Volume Profile: Shows where most trading happened. High volume nodes act as strong support/resistance zones.
Technical analysis works best in liquid markets like Bitcoin and Ethereum. In low-cap altcoins, one whale selling can break any technical pattern. Always be careful with thin order books.
The Hybrid Strategy: Best of Both Worlds
Stop asking which is better. Ask which tool fits your current job. The smartest move is combining them. Use fundamentals to pick *what* to buy. Use technicals to decide *when* to buy.
Here is a practical workflow:
- Step 1: Screen Fundamentals. Find projects with growing user bases and strong dev teams. Maybe you pick Chainlink because its oracle usage is exploding across DeFi.
- Step 2: Wait for Technical Setup. Don't buy immediately. Look for a pullback to a key moving average or a breakout from a consolidation range.
- Step 3: Execute Trade. Enter the position when the chart confirms the trend aligns with your fundamental thesis.
- Step 4: Manage Risk. Set stop-losses based on technical levels (e.g., below recent support), not arbitrary percentages.
This method filters out bad projects (via fundamentals) and avoids buying at tops (via technicals). It reduces emotional decision-making significantly.

Pitfalls to Avoid
Both methods have blind spots. Fundamental analysis struggles with timing. A great project can stay undervalued for years. You might be right about the tech but wrong about the timeline, bleeding cash while waiting for recognition.
Technical analysis fails during black swan events. No chart pattern predicted the sudden regulatory bans or exchange collapses like FTX. Technicals assume rational behavior within existing conditions. When the rules change overnight, charts become useless until new trends form.
Also, beware of confirmation bias. If you love a coin's mission, you'll ignore bearish technical signals. If you're obsessed with a chart pattern, you'll ignore terrible tokenomics. Stay honest with yourself.
Which Should You Learn First?
If you are new to crypto, start with basics of fundamental analysis. It teaches you how the technology works and why assets have value. It prevents you from getting rug-pulled by meme coins with no utility.
Once you understand the landscape, learn technical analysis to improve your entry points. You don't need to master every indicator. Start with support/resistance and moving averages. Keep it simple. Complexity leads to paralysis.
Remember, the goal isn't to be a perfect predictor. It's to manage risk and find asymmetric opportunities-where potential upside outweighs downside. Whether you use charts or code reviews, keep your strategy disciplined.
Can I rely solely on technical analysis for crypto investing?
You can, especially for short-term trading. However, relying only on technicals is risky for long-term holdings. Charts don't tell you if a protocol is secure, if the team is trustworthy, or if the token supply is sustainable. For HODLing, fundamental risks matter more than short-term price wiggles.
What are the most important fundamental metrics in crypto?
Active addresses, transaction volume, Total Value Locked (TVL) for DeFi, developer activity on GitHub, and token distribution schedules. Also, assess the problem the project solves and whether it has product-market fit. Metrics vary by sector; NFTs focus on floor price and mint rates, while Layer 1s focus on network security and throughput.
Does fundamental analysis work in a bear market?
Yes, even better. Bear markets reveal weak projects. Strong fundamentals help you identify assets that will survive and recover. During crashes, technicals often give false signals due to panic selling. Fundamentals provide the conviction needed to accumulate quality assets at discounted prices.
How long should I hold if I use fundamental analysis?
Typically months to years. Fundamental thesis changes slowly. If you bought based on a 5-year roadmap, don't sell because of a 1-week dip. Re-evaluate your position only if the core fundamentals deteriorate, such as loss of key developers, major security breaches, or failure to meet milestones.
Are technical indicators accurate for all cryptocurrencies?
No. They work best on high-liquidity assets like Bitcoin and Ethereum. Low-cap altcoins are prone to manipulation and low volume, making technical patterns unreliable. Always check volume before trusting a signal. If volume is low, the price move may lack conviction and reverse quickly.

Categories
Popular Articles