
Prices don't move just because of earnings reports or interest rates. They move because people feel something-fear, greed, hope, or panic. Sentiment Analysis is the computational process of determining whether textual information conveys positive, negative, or neutral opinions about financial assets. It turns those messy human emotions into hard data you can trade.
If you are looking at charts and missing the story behind the moves, you are leaving money on the table. This guide breaks down how to turn news, social media posts, and earnings calls into actionable trading signals.
What Is Sentiment Analysis in Trading?
At its core, sentiment analysis uses Natural Language Processing (NLP) is a branch of artificial intelligence that helps computers understand, interpret, and derive meaning from human language to scan vast amounts of unstructured text. Think of it as a machine reading millions of tweets, news headlines, and forum posts to answer one question: Are investors bullish or bearish right now?
This isn't new magic. The concept started gaining traction around 2010-2012 when social media exploded and machine learning got better. But today, it is a standard tool for quant funds and retail traders alike. The goal? To spot market inflection points before they show up on your price chart.
Traditional technical analysis looks at what has already happened (price history). Fundamental analysis looks at value (earnings, revenue). Sentiment analysis looks at behavior. And often, behavior changes first.
Why Emotions Drive Markets Before Prices Do
Markets are psychological. When everyone is greedy, prices get stretched. When everyone is terrified, prices get crushed. Sentiment analysis quantifies this mood.
Consider the American Association of Individual Investors (AAII) Sentiment Survey is a weekly survey that measures the percentage of individual investors who feel bullish, bearish, or neutral about the stock market's direction over the next six months. Historically, when bullish readings hit above 55%, it has coincided with market tops in 78% of cases between 2000 and 2022. That is not noise; that is a signal.
Another example is the CNN Fear & Greed Index. Since 2015, when this index spiked above 80 (extreme greed), the S&P 500 corrected by at least 5% within 30 days in 83% of instances. If you had traded against that extreme sentiment, you would have caught significant moves early.
The key insight here is contrarianism. Extreme sentiment usually marks a turning point, not a continuation. Dr. Richard Peterson, CEO of MarketPsych, puts it simply: "Sentiment analysis works best as a contrarian indicator at extremes, not as a directional signal."
Data Sources: Where the Signals Come From
You cannot analyze sentiment if you do not have data. Modern systems pull from three main buckets:
- News Articles: Financial press releases, Reuters, Bloomberg. These provide structured, high-quality information but may have a slight delay.
- Social Media: Twitter (X), Reddit (like r/WallStreetBets), StockTwits. This is raw, fast, and noisy. It captures retail frenzy instantly.
- Earnings Calls & Transcripts: Audio and text from company executives. Tone, hesitation, and word choice matter here.
Vendors like Sentdex is a platform that analyzes approximately 4,000 news sources and 10 million social media posts per day to generate sentiment scores for over 5,000 U.S. equities process this volume daily. They create "date-entity-sentiment" tuples. For example: [Date: May 29, 2026] - [Entity: Tesla] - [Sentiment Score: +0.8].
For individual stocks, these scores are numerical. Positive numbers mean bullish phrasing; negative numbers mean bearish phrasing. A well-built system can achieve correlation coefficients of 0.65-0.75 with price movements over a 3-5 day horizon. That is strong predictive power if you know how to use it.
Building Your Strategy: Contrarian vs. Momentum
Having data is useless without a strategy. Here are the two most common ways traders use sentiment signals:
1. The Contrarian Approach (Best for Reversals)
When sentiment hits an extreme, bet against it. If the Investors Intelligence advisory sentiment ratio (bullish:bearish) exceeds 3.0, subsequent 30-day S&P 500 returns average -1.2%. If it drops below 1.0, returns average +1.8%. You buy when others are selling out of fear, and sell when others are buying out of euphoria.
2. The Divergence Strategy (Best for Trend Confirmation)
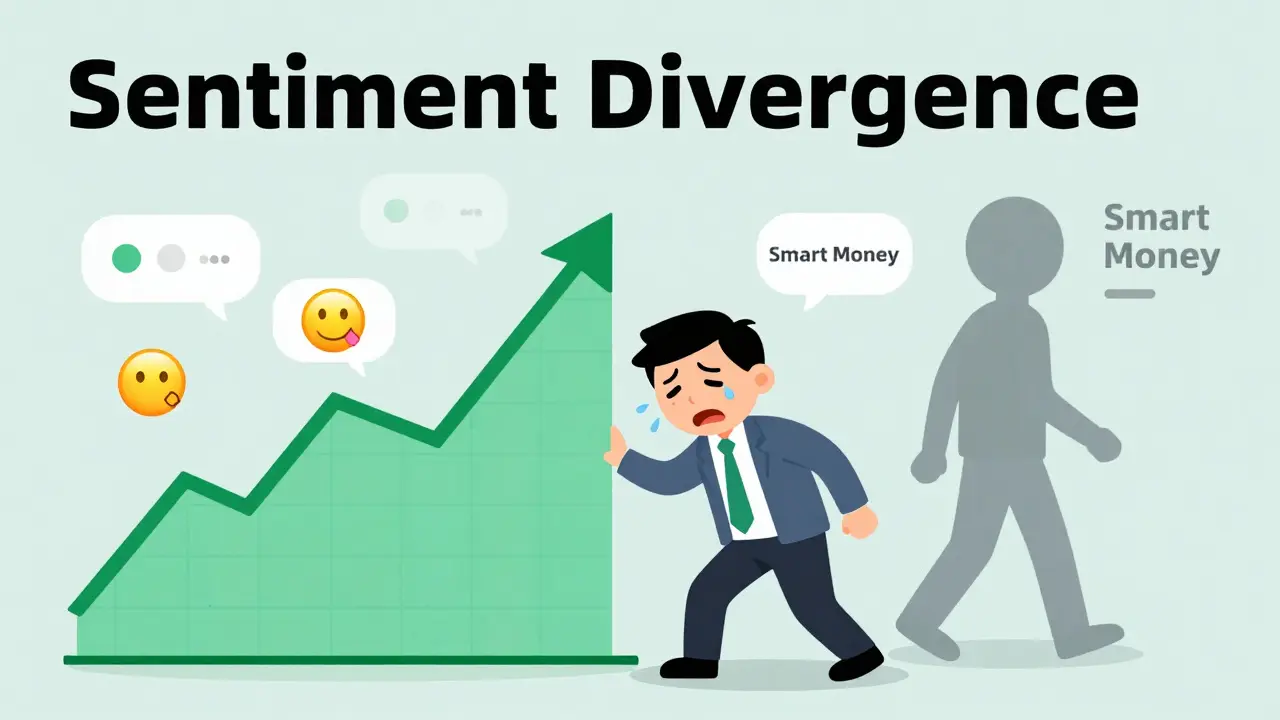
Look for mismatches between price and sentiment. If a stock makes a new high in price but sentiment fails to reach new bullish highs, the trend is weak. This "sentiment divergence" strategy generated a 62% win rate in S&P 500 futures trading from 2015-2022. It warns you that the rally might be running out of steam even though the chart still looks good.
| Strategy Type | Signal Trigger | Best Market Condition | Risk Level |
|---|---|---|---|
| Contrarian | Extreme bullish/bearish scores | Range-bound or topping markets | High (catching falling knives) |
| Divergence | Price up, Sentiment flat/down | Trending markets losing momentum | Medium |
| Momentum | Rising sentiment + Rising price | Strong bull runs | Low to Medium |
Tools and Implementation: DIY vs. Vendors
Do you build it or buy it? It depends on your skills and budget.
Buying Data: Services like Sentdex Premium cost around $499/month. PsychSignal and Accern offer similar feeds. These are plug-and-play. You get clean scores without worrying about coding. However, costs add up, and you are limited to their methodology.
Building Custom Pipelines: Institutional traders and advanced quants use Python libraries like NLTK is the Natural Language Toolkit, a suite of libraries and programs for symbolic and statistical natural language processing, spaCy, and TensorFlow. You can scrape Twitter or news sites and run them through models like FinBERT. This requires 200+ hours of development time and deep NLP expertise. But you own the model and can tweak it for specific niches, like crypto or small-cap stocks.
For most retail traders, using built-in tools on platforms like thinkorswim (Volatility Index) or subscribing to a mid-tier vendor is the sweet spot. It balances cost, ease of use, and data quality.

Pitfalls: Why Sentiment Analysis Fails
Sentiment analysis is not a crystal ball. It has blind spots.
- Noise and Sarcasm: Algorithms struggle with irony. A tweet saying "Great job crashing the market!" might be read as positive by a basic model. Advanced vendors use context-aware AI to fix this, but errors happen.
- Macro Overwhelms Micro: During the March 2020 crash, fundamental drivers (pandemic fears) overwhelmed sentiment indicators. Retail sentiment remained cautiously optimistic while the VIX spiked above 80. Sentiment signals went false because the entire system was breaking down.
- Manipulation: A 2023 MIT study found that 41% of retail investor sentiment on social media is deliberately manipulated by coordinated groups. In crypto, this is rampant. Pump-and-dump schemes create fake bullish sentiment to lure buyers. Always verify social media spikes with volume and order flow data.
- Lag: While faster than price action, sentiment is still reactive. By the time a sentiment score updates, the smart money may have already moved.
Nobel laureate Robert Shiller warns that "short-term sentiment fluctuations are noise, not signal." He is right if you look at every tiny blip. Focus on trends and extremes, not daily jitter.
The Future: Multimodal and AI-Driven Insights
The field is evolving fast. Text is no longer enough. J.P. Morgan launched "Speech Analytics" in 2023, which analyzes CEO tone and speech patterns during earnings calls. This multimodal approach improved earnings surprise prediction accuracy by 12%. Voice stress and hesitation reveal more than words alone.
Generative AI is also entering the mix. Tools like Accern’s SentimentGPT claim 28% higher accuracy in detecting nuanced sentiment by understanding context better than older statistical models. By 2026, we expect real-time geopolitical event mapping and cross-asset sentiment contagion analysis to become standard, potentially boosting predictive power by 35-40%.
However, regulation is catching up. The SEC noted that algorithmic strategies using sentiment data contributed to 17% of volatility spikes in small-cap stocks during 2021. Expect stricter scrutiny on automated sentiment-driven trades in the coming years.
Next Steps for Traders
Start small. Do not automate your entire portfolio based on sentiment tomorrow. Pick one asset class (e.g., large-cap tech stocks) and one data source (e.g., news headlines). Track the sentiment scores manually for a month. Compare them to price action. Look for divergences and extremes. Once you see the pattern with your own eyes, then consider adding it to your trading system as a confirmation tool, not a primary trigger.
Is sentiment analysis profitable on its own?
Rarely. Most experts agree that sentiment analysis should complement traditional technical and fundamental analysis, not replace it. A 2022 Tabb Group survey found that 87% of institutional trading desks use sentiment data only as a secondary confirmation tool. Using it alone exposes you to false signals from noise or manipulation.
Which sentiment indicator is best for beginners?
The AAII Sentiment Survey and the CNN Fear & Greed Index are excellent starting points. They are free, widely available, and track broad market psychology rather than single-stock noise. They help you understand the overall mood of the market, which is crucial for position sizing and risk management.
Can I use sentiment analysis for cryptocurrency trading?
Yes, and it is actually more prevalent there. CryptoCompare reports that sentiment analysis accounts for about 30% of algorithmic trading signals in crypto, compared to 15% in traditional equities. However, be cautious of manipulation, as social media sentiment in crypto is heavily influenced by coordinated pump-and-dump campaigns.
How much does professional sentiment data cost?
Premium services like Sentdex charge around $499 per month. Institutional-grade solutions from firms like Accern or Bloomberg Terminal packages can cost thousands per month. For retail traders, free indices or lower-cost third-party APIs are often sufficient to start.
What is "sentiment divergence"?
Sentiment divergence occurs when the price of an asset makes a new high, but the sentiment score fails to match that new high. This suggests that the buying pressure is weakening despite the rising price, often signaling an impending reversal or correction. It is a powerful warning sign for trend-following traders.